1. Introduction
Nanofluidics is the study and manipulation of fluids confined within 1–100 nm. [1-3]. Nanofluidics involves the control, manipulation, and transport of fluids inside the nanopore. The physics observed inside nanopore structures is not observed in larger micro and bulk structures. The electrolyte solution used is KCl [4-7] and sodium phosphate made from sodium phosphate monobasic monohydrate NaH2PO4 and sodium phosphate dibasic heptahydrate Na2HPO4 [8,9]. The ion transport is studied by applying a voltage and measuring the ionic current in a single nanopore or nanopores. The nanopore surface has a negative charge contributed by the surface potential of the nanoporous membrane [10]. Under the application of voltage, the ion transport inside the nanopore is dominated by the surface interaction of the nanopore and its volume. The ratio of surface area to volume is large inside the nanopores. This results in a larger electrostatic force on the transport inside the nanopores. The surface of the nanopore parameters are surface charge density, material, and surface potential. The parameters have recently been explored in detail from the visual relation to the pore geometry [11]. The behaviour of fluid changes at the nanoscale compared to the bulk scale, because atomic and molecular interactions between solid-liquid interfaces play a significant role at such small length scales. In recent studies, there is a focus on single and multiple nanopore membranes to understand the ionic current–time. However, the solid–state nanopores have significantly higher noise than the biological membranes. There are different nanopore membrane materials silicon nitride sputtered with silicon dioxide [12], graphene [13], and molybdenum disulfide (MoS2) [14]. The conical nanopores are being researched to understand the ion transport. The conical nanopores rectify the ion transport. Thus, the ion current is higher for voltages applied and their one direction compared to polarity change of the voltage and its direction. The polarity change of the voltage and direction inside the conical nanopores results in lower current [15]. Nowadays, new research on conical nanopores is towards understanding how to build computing technology [16].
Here we study the current-time oscillations inside the conical nanopores. We develop an oscillation numerical model to understand the ion transport in the conical nanopores. We study the noise in the current inside the conical nanopores. In our oscillation model, we take into consideration the charge term, electrokinetic term, thermal current noise, and charge carrier noise to obtain the current-time oscillations inside the conical nanopores. Here we study the current-time oscillations inside the nanopores. We study graphene nanopores. Graphene has no negative surface charge on the walls of the nanopore. We study the noise in the current inside the nanopores. We measure the Power Spectral Density (PSD) from ionic current-time oscillations inside the nanopores. There is 1/f noise in the nanopores. The reason for the 1/f noise and current oscillations inside the nanopores is are pore diameter only. Further, we study the conductance as a function of concentration inside the nanopores. Furthermore, we study the linear current-voltage relationship inside the nanopores. The nanofluidics can find applications in single-molecule sensing, electrokinetic pumps, preconcentration of analytes using electric field focusing, water desalination, energy storage, energy, and memristor neuromorphic computing applications.
2. Theory
Steady-state ion current calculations for the conical nanopore
The volume of the conical nanopore is given by Eq. (1)
Where Vcn is the volume of the conical nanopore, R is the large radius, and r is the small radius. Lcn is the thickness of the conical nanopore. Here, the small radius is 2.5 nm and the large radius is 150 nm. The thickness of the conical nanopore is 12 µm [15]. The volume of the conical nanopore is Vcm = 2.9 X 10⁻¹⁹ m3. We consider the voltage to be 0.85 V. We consider a 1 M KCl concentration. The conical nanopore parameters are given in Tables 1,2, respectively.
Table 1: Conical nanopore list 1 model parameters.
Table 2: Conical nanopore list 2 model parameters.
The steady state ion current in the conical nanopore is given by Eq. (2).
where q is the charge of KCl, u is the velocity, m is the mass of KCl, a is the acceleration of KCl, and φ is the electric potential in the conical nanopore. We consider equal contribution of steady state current due to potassium ions (
) and chlorine ions (
).
The steady-state potassium ion current in the conical nanopore is given by Eq. (3).
where
is the potassium ion current,
is the charge of the potassium ion, and
is the mass of the potassium ion.
The steady state chlorine ion current in the conical nanopore is given by Eq. (4).
where
is the chlorine ion current,
is the charge of the chlorine ion, and
is the mass of the chlorine ion.
The steady-state ion current in the conical nanopore is given.
In the numerical model, the current from the concentration calculated charge contributes 64%. The reason for the oscillations in the experiments was due to the pore diameter and salt concentration. The evidence in the experiments directly showed the role of salt concentration.
We show the concentration of potassium calculated charge and their current given by the term charge current
is high in the potassium ion current Eq (3) for conical geometry nanopore. We understand the current in a conical nanopore has an electrokinetic contribution from the potential, potassium ion migration, and convective components. This is presented in our numerical simulation for a conical nanopore. The term is
that contributes to 36% of the potassium ion current in the conical nanopore.
We show the concentration of chlorine calculated charge and their current given by the term charge current
is high (64%) in the chlorine ion current Eq (4) for conical geometry nanopore. We understand the current in a conical nanopore has an electrokinetic contribution from the potential, chlorine ion migration, and convective components. This is presented in our numerical simulation for a conical nanopore. The term is
that contributes to 36% of the chlorine ion current in the conical nanopore. Earlier works are usually COMSOL, OpenFOAM, and molecular dynamics software. Our model reduces the computational cost by capturing the effects of the influence of conical nanopore geometry by volume. We consider the electrokinetic convective contribution, electric potential, KCl individual potassium ion migration, chlorine ion migration, and charge transport. In order to understand the current oscillations, we go in-depth on the current-time signal [15]. In our analysis, we consider the time step to be 1 s.
3. Results and discussion
Current oscillations of the conical nanopore, high-frequency thermal current noise
The high-frequency thermal current noise is given in Eq. (5).
where Ihigh is the high-frequency thermal current noise, k is the Boltzmann constant, Gcn is the conductance of the conical nanopore, T is the temperature, and B is the frequency bandwidth in Hz.
The conductance (Gcn) of the conical nanopore is obtained from Eq. (6).
Using Eq. (6), we obtain that the conductance in the conical nanopore is 894 pS. The high-frequency thermal current noise is given in Eq. (5). The value of the high-frequency thermal current noise is small [17].
Low-frequency charge carrier current noise
The low-frequency charge carrier current noise is given in Eq. (7).
where Ilow is the low-frequency charge carrier current noise. Acn is the noise property defined by the conical pore, small and large diameters. Further, the noise property is related to KCl concentration given in Eq. (8). fL is the low-frequency term given in Eq. (9). We consider KCl concentration to be 2000 mM [15].
where α is the fitting parameter (α = 0.36). The noise property is 20 pC.
where tL is the time 1s to calculate the low-frequency noise. The noise property Acn, we call the charge carrier term. The noise property Acn is fixed and oscillates every second, where the frequency (fL) is 1 Hz. The contribution of the low-frequency charge carrier current noise and high-frequency thermal current noise to the current inside the conical nanopore is given in Eq. (10).
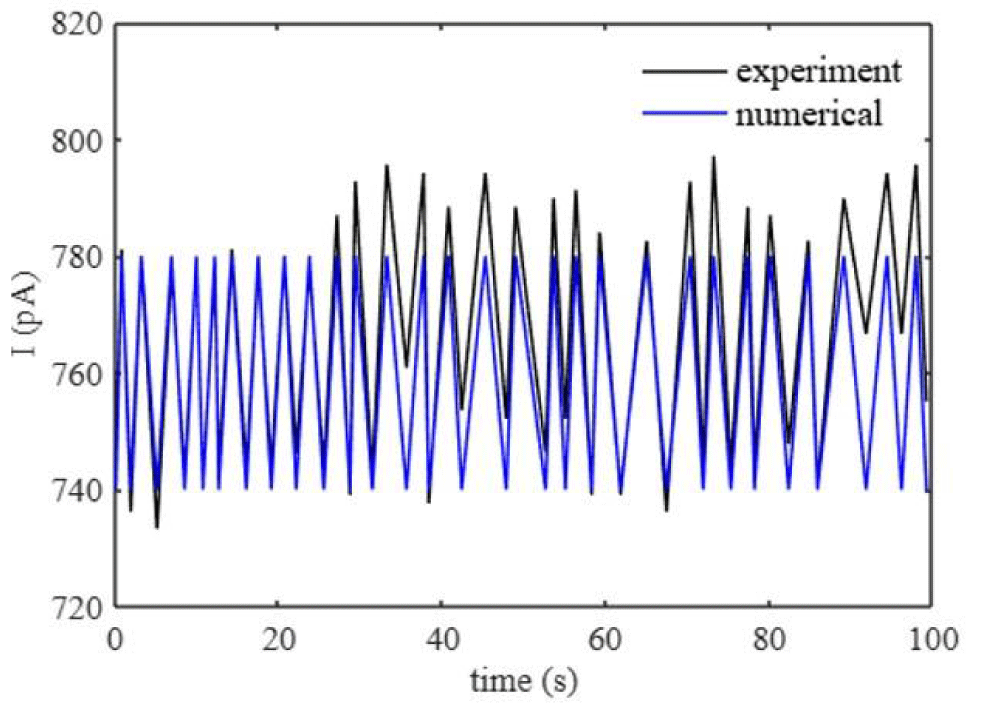
Where Icn are the ion current inside the conical nanopore that captures the oscillations. Figure 1 shows the current inside the conical nanopore that matches the literature [15].
Figure 1: Current oscillations of a conical nanopore. The experiment results of the conical nanopore are in [15].
3.1 Steady-state ion current calculations for the nanopore
The volume of the nanopore is given by Eq. (11)
where Vnp is the volume of the nanopore, Rnp is the radius of the nanopore, and Lnp is the thickness of the nanopore. In this study, the radius is 5 nm and the thickness of the nanopore is 0.34 nm. We study the graphene nanopore in our model [13]. The volume of the nanopore is Vnp = 2.7 × 10⁻²⁶ m3. The voltage is 0.1 V. We consider 1M KCl. The nanopore parameters are given in Tables 3,4, respectively.
Table 3: The nanopore list 1 model parameters. The concentration of KCl is 1M.
Table 4: The nanopore list 2 model parameters. The concentration of KCl is 1M.
The steady state ion current in the nanopore (Inp) is given by Eq (12).
where q is the charge of KCl, u is the velocity, m is the mass of KCl, a is the acceleration of KCl, and φ is the electric potential in the nanopore. We consider equal contribution of steady state current to potassium ions
and chlorine ions
.
The steady-state potassium ion current in the nanopore is given by Eq. (13).
where
is the potassium ion current,
is the charge of the potassium ion, and
is the mass of the potassium ion.
The charge of the potassium ion is given in Eq. (14).
where
is the valence of the potassium ion. We consider
is the concentration of the potassium ions. F is Faraday’s constant.
The steady state chlorine ion current in the nanopore is given by Eq. (15).
where
is the chlorine ion current,
is the charge of the chlorine ion, and
is the mass of the chlorine ion.
The charge of the chlorine ion is given in Eq. (16).
where
is the valence of the chlorine ion. We consider
is the concentration of the chlorine ion.
The charge of the KCl (q) is given in Eq. (17).
The steady-state ion current in the nanopore is given.
The graphene nanopores do not have a surface charge [13]. In our numerical model, the charge current term
contributionis 0.02%. In the graphene nanopore experiments [13], the current oscillations are dependent on the pore diameter only. The KCl salt concentration showed weak dependence on the current oscillations in the graphene nanopore experiments. In our study, the charge obtained from the concentration is small. Table 3 shows the charge of potassium ions and chlorine ions calculated. The charge current of the potassium ions
is small. We understand the current in the nanopore has a large electrokinetic contribution from the potential, potassium ion migration, and convective components. The term is
that contributes to 100% of the potassium ion current in the nanopore. We observe fast mass-only transport from our model. The fast mass transport is observed inside a graphene nanopore [13].
The charge current of chlorine ions
is small. The electrokinetic term of the chlorine ions
contributes to 100% of the chlorine ions in the nanopore. Our model reduces the computational cost by capturing the effects of the influence of nanopore geometry by volume. We consider the electrokinetic convective contribution, electric potential, KCl individual potassium ion migration, chlorine ion migration, and charge transport. In order to understand the current oscillations, we go in-depth on the current-time signal [13]. In our analysis, we consider the time step to be 0.05 s. We study for 4 s. The frequency is therefore 0.25 Hz to 20 Hz.
3.2. Current oscillations of the nanopore, high-frequency thermal current noise
The high-frequency thermal current noise is given in Eq. (18).
Where Ihigh is the high-frequency thermal current noise, k is the Boltzmann constant, Gnp is the conductance of the nanopore, T is the temperature, and B is the frequency bandwidth in Hz.
The conductance (Gnp) of the nanopore is obtained from Eq. (19).
Using Eq. (19), we obtain that the conductance in the nanopore is 80 nS. The high-frequency thermal current noise is given in Eq. (18). The value of the high-frequency thermal current noise is small [17].
Low-frequency charge carrier current noise
The low-frequency charge carrier current noise inside the nanopores is given in Eq. (20).
where llow is the low-frequency charge carrier current noise. Anp is the noise property defined by the pore diameter only. We consider the KCl concentration to be 2000 mM [13]. The noise property we call the charge carrier term is given in Eq. (21).
where α is the fitting parameter (α = 5e6). The noise property Anp is 0.026 nC. The large fitting parameter for graphene to show the charge carrier current noise is consistent with the discussion on the noise inside the graphene nanopores that Hooge’s relation has to be revisited in the graphene nanopores [13]. We consider fL to be the low-frequency term given in Eq. (22).
Where tL is the time step is 0.05s, to calculate the low-frequency noise. The low frequency fL used here is 20 Hz. The noise property An is fixed and oscillates with the time step given. The contribution of the low-frequency charge carrier current noise Ilow is 0.52 nA. The contribution of the low-frequency charge carrier current noise and high-frequency thermal current noise to the current inside the nanopore is given in Eq. (23).
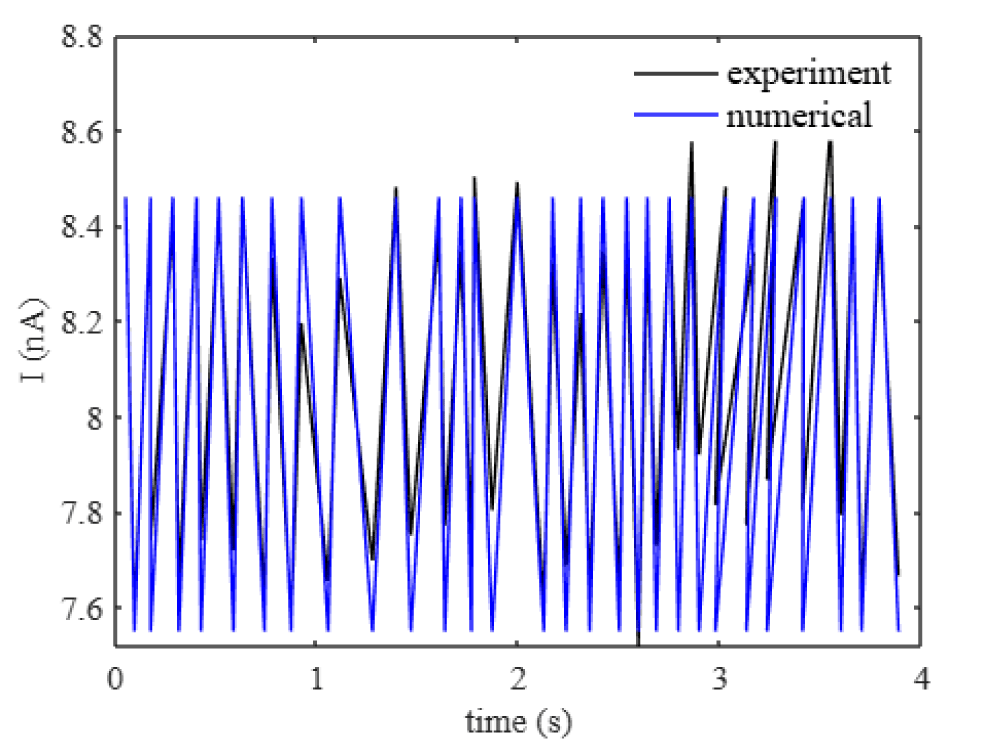
where Inp are the ion current inside the nanopore that captures the oscillations. Figure 2 shows the current inside the nanopore that matches the literature [13].
Figure 2: Current oscillations of a nanopore (d = 10 nm) for the applied voltage of 0.1 V. The experiment results of the nanopore are in [13].
3.3. Power spectral density (PSD) analysis for the current noise inside the nanopore
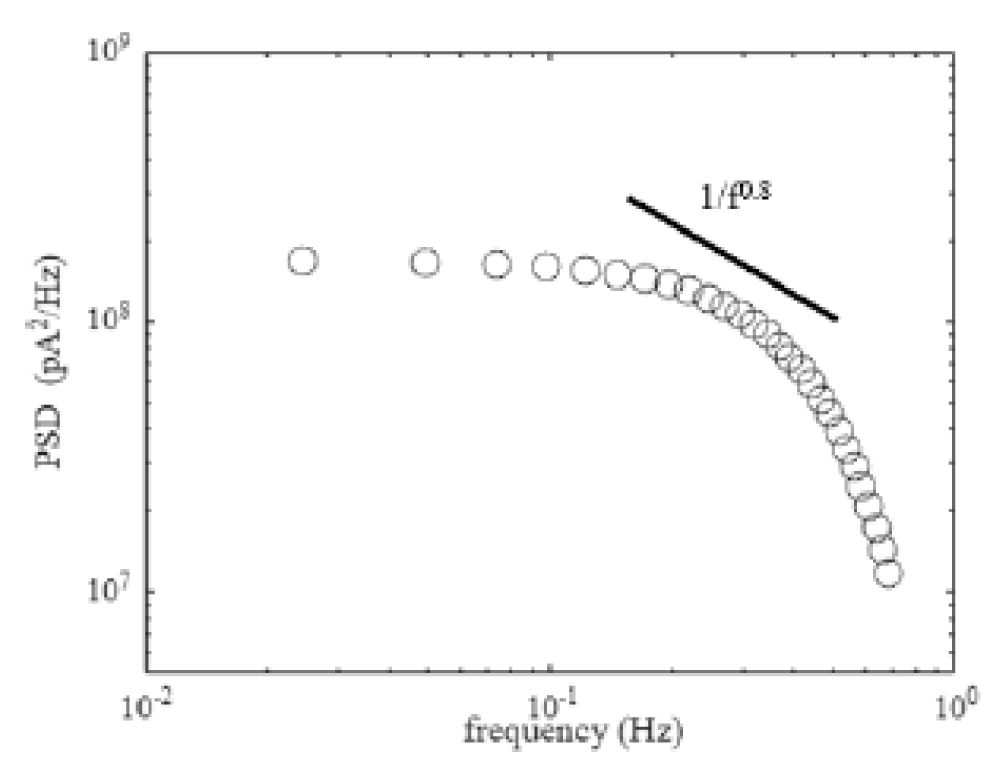
We perform the PSD analysis on the current-time numerical simulation for the nanopore. The current-time dynamics of the nanopore are shown in Figure 2. Figure 3 shows the PSD against frequency for the current-time dynamics discussed in Figure 2. The frequency we consider is between 0.01 Hz to 1 Hz. The PSD of the ionic current is calculated using the Welch method [18]. We capture the low-frequency noise scales as 1/1s with s ≈ 0.8. The nanopore under study is a graphene nanopore [13]. The low frequency 1/f is common for the current-time in graphene nanopores. The 1/f noise in graphene nanopores is due to the pore diameter. The 1/f noise in graphene nanopores has weak dependence on the salt concentration [13]. In our study, we calculate the low-frequency charge carrier current noise from the α = 5e6 parameter. We understand that the charge carrier current noise has a significant volume term. The volume term has the diameter of the graphene nanopore. Hence, we argue that the 1/f noise in graphene nanopores is also due to the pore diameter, similar to the experiments.
Figure 3: PSD against frequency for the graphene nanopore. The PSD analysis is carried out for the current-time signal considered in Figure 2. The low-frequency 1/f noise in the current is due to the pore diameter.
3.4. Relationship between conductance and solid-state nanopore
We performed the study for nanopore for the thickness of Lnp = 20 nm and radius 5 nm [12]. We study solid-state nanopores. The ionic conductance (G) is related to ionic current (I) and applied voltage (V). The ionic conductance is given by Eq. (24).
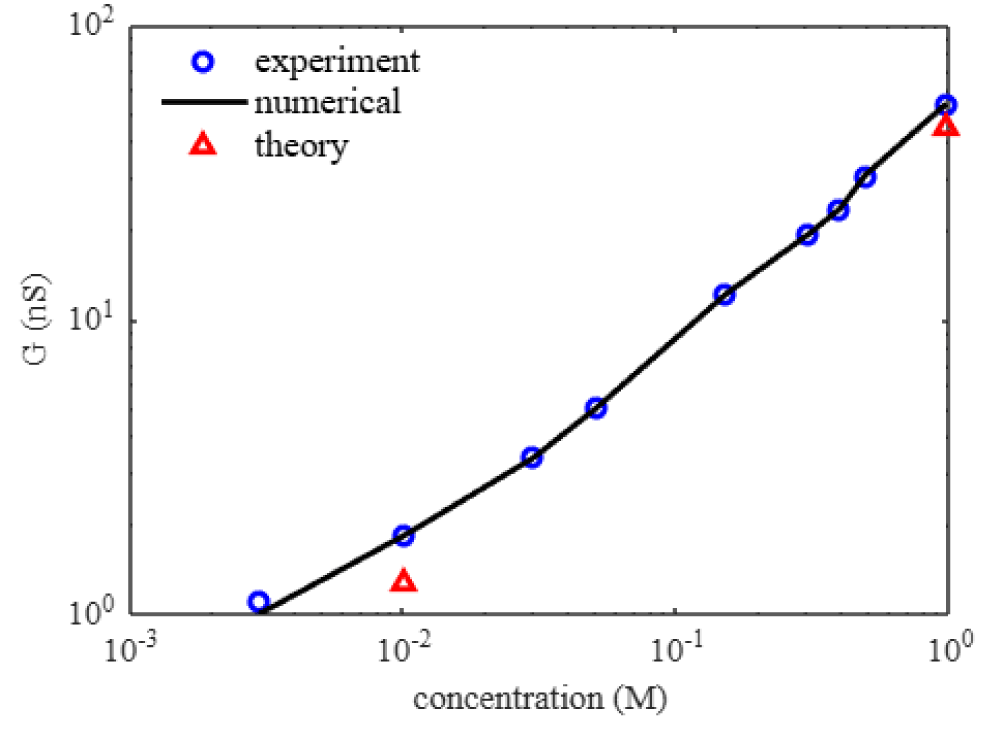
The ionic conductance inside the nanopore varies significantly compared to the micropore and bulk pore. The nanopore parameters are the geometry that includes length and pore diameter. The surface of the nanopore influences the transport of the KCl. Figure 4 shows the conductance variation with KCl concentration for the nanopore.
Figure 4: Ionic conductance (G) variation with KCl concentration. The blue circles are experiments [12], the black line is numerical, and the red triangles are theory given in Eq. (25).
We understand the conductance strongly increases with KCl concentration. The conductance is not linear with KCl concentration. This is due to the salt-dependent surface charge of the nanopore [12]. The existing model given by Eq. (25) captures the conductance variation with the concentration by the pore diameter, volume, and pore geometry [19]. The surface charge is not salt-dependent and is used in the equation with fitting parameters. The term having a surface charge given in terms 1 and term 2 contributes little to the model. The bulk conductivity term Kb is obtainable [20]. The existing model considers the pore diameter and volume as the dominant contribution to the conductance. The bulk conductivity is the multiplier that changes with KCl concentration, as given in Table 5. Figure 4 shows the conductance for two KCl concentration points only obtained by the model given in Eq. (25).
Table 5: Conductivity variation with KCl concentration [20].
Where Kb is the bulk conductivity, L is the pore length, and d is the pore diameter. We assume the pore diameter is 15 nm. lDu is the Dukhin length given in Eq. (26).
where σ = 0.7 mc/m2 is the absolute surface charge density. F is the Faraday’s constant and cs is the bulk concentration. γ is a geometrical prefactor fit and β is a fitting parameter (here, γ =1, β = -3 )to obtain the best match with the literature [12].
3.5. Numerical simulation
We understand the conductance strongly increases with KCl concentration. The conductance is not linear with KCl concentration. We use our numerical simulation to calculate the current inside the nanopore given by Eq. (12) discussed in the earlier section. This is due to the charge term of current
. The charge q is a function of concentration. The charge q has the volume of the nanopore. The term
is the electrokinetic term that has the ion mass, ion velocity, acceleration, electric potential, and ion migration.
3.6. Smoluchowski model to calculate the velocity of the KCl
The velocity of the KCl inside the nanopore is calculated from the Smoluchowski model given in Eq. (27) [21-23].
where u is the velocity of the KCl inside the nanopore, µE is the mobility of the KCl inside the nanopore.
where E is the electric field inside the nanopore and V is the applied voltage. Lnp is the thickness of the nanopore. The thickness of the nanopore is 20 nm, and the radius is 5 nm. We consider applied voltage = 0.05 V. We consider ∆V = 0.05 V. The electric field is 2.5 × 10⁶ V/m.
3.7. Mobility of the potassium chloride electrolyte
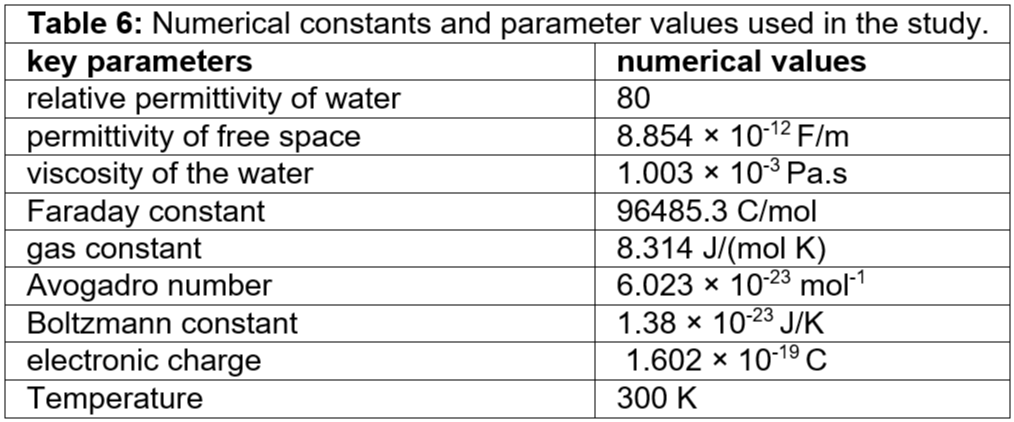
We consider the surface potential of the membrane having a single nanopore to be 0.052 V [10]. The mobility of the KCl inside the nanopore is 3.7×10⁻⁸ (Am/N). The velocity of KCl inside the nanopore is 92 mm/s. Table 6 gives the parameters used in the velocity calculations. In this study, for a voltage of 0.05 V, u = 0.25 mm/s is the assumed velocity of the potassium ions, chlorine ions, and KCl inside the nanopore. a = 1 mm/s2 is the assumed acceleration of the potassium ions, chlorine ions, and KCl inside the nanopore.
kg is the assumed mass of the potassium ions, chlorine ions inside the nanopore. Further, we assume the velocity is varied according to the voltage. Tables 7 to 33 show the conductance and nanopore parameters used in the model for different KCl concentrations. Figure 4 shows the numerical results of the conductance variation with KCl concentration. In our numerical simulation, we observe that the conductance strongly increases with KCl concentration. The conductance is not linear with KCl concentration. We account for the salt-dependent charge of the nanopore, pore diameter, pore thickness, pore geometry, pore volume, electric potential, electrokinetic term, ion mass, ion migration, ion velocity, acceleration, charge transport, and convective contribution in our numerical simulation. We could understand the experimental observations in our numerical simulation [12].
Table 6: Numerical constants and parameter values used in the study.
Table 7: Conductance and nanopore list 1 model parameters. The concentration of KCl is 3 mM.
Table 8: Conductance and nanopore list 2 model parameters. The concentration of KCl is 3 mM.
Table 9: Conductance and nanopore list 3 model parameters. The concentration of KCl is 3 mM.
Table 10: Conductance and nanopore list 4 model parameters. The concentration of KCl is 10 mM.
Table 11: Conductance and nanopore list 5 model parameters. The concentration of KCl is 10 mM.
Table 12: Conductance and nanopore list 6 model parameters. The concentration of KCl is 10 mM.
Table 13: Conductance and nanopore list 7 model parameters. The concentration of KCl is 30 mM.
Table 14: Conductance and nanopore list 8 model parameters. The concentration of KCl is 30 mM.
Table 15: Conductance and nanopore list 9 model parameters. The concentration of KCl is 30 mM.
Table 16: Conductance and nanopore list 10 model parameters. The concentration of KCl is 50 mM.
Table 17: Conductance and nanopore list 11 model parameters. The concentration of KCl is 50 mM.
Table 18: Conductance and nanopore list 12 model parameters. The concentration of KCl is 50 mM.
Table 19: Conductance and nanopore list 13 model parameters. The concentration of KCl is 150 mM.
Table 20: Conductance and nanopore list 14 model parameters. The concentration of KCl is 150 mM.
Table 21: Conductance and nanopore list 15 model parameters. The concentration of KCl is 150 mM.
Table 22: Conductance and nanopore list 16 model parameters. The concentration of KCl is 300 mM.
Table 23: Conductance and nanopore list 17 model parameters. The concentration of KCl is 300 mM.
Table 24: Conductance and nanopore list 18 model parameters. The concentration of KCl is 300 mM.
Table 25: Conductance and nanopore list 19 model parameters. The concentration of KCl is 400 mM.
Table 26: Conductance and nanopore list 20 model parameters. The concentration of KCl is 400 mM.
Table 27: Conductance and nanopore list 21 model parameters. The concentration of KCl is 400 mM.
Table 28: Conductance and nanopore list 22 model parameters. The concentration of KCl is 500 mM.
Table 29: Conductance and nanopore list 23 model parameters. The concentration of KCl is 500 mM.
Table 30: Conductance and nanopore list 24 model parameters. The concentration of KCl is 500 mM.
Table 31: Conductance and nanopore list 25 model parameters. The concentration of KCl is 1000 mM.
Table 32: Conductance and nanopore list 26 model parameters. The concentration of KCl is 1000 mM.
Table 33: Conductance and nanopore list 27 model parameters. The concentration of KCl is 1000 mM.
3.8. Influence of the transport of the ion in the solid-state nanopore
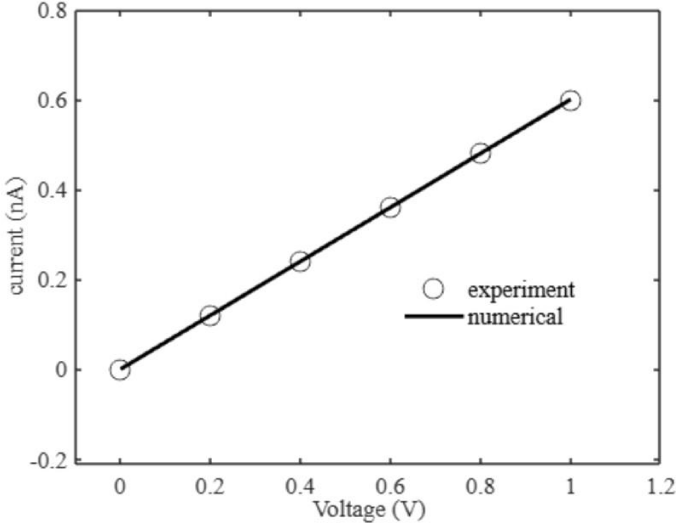
Here we study the linear current-voltage inside the solid state nanopore [24]. We consider a nanopore of thickness 10 nm and radius 0.5 nm. We study 1 M KCl. The reason for the linear I-V characteristics is due to the pore diameter, pore thickness, and pore geometry, charge, surface charge of the nanopore, concentration, and ion mobility [24]. The experiment nanopore considered is silicon nitride. The surface potential of the silicon nitride is unknown. Tables 34 to 37 show the parameters used in our numerical simulation to match the I-V characteristics given in the literature [24]. In our simulation, the pore diameter is 1 nm, the pore thickness is 10 nm, and the pore geometry we consider is volume (Vnp) only. We calculate the charge from concentration, volume, Faraday’s constant, and valence of KCl. We separate the contribution of mobility and ion mass. We assume the ion mass. We assume the ion velocities that are reasonable in the nanopore [22,23] due to the unknown parameter surface potential of the silicon nitride nanoporous membrane. The parameter surface potential, in combination with the Smoluchowski model, gives the velocity of the ions as given in the earlier section. The surface charge can be obtained from the surface potential the Coulomb’s law. We consider a 1 M KCl concentration. The ion mobility gives the ion velocity in the Smoluchowski equation as given in the earlier section. In our study, we consider the current contribution from the charge term and the electrokinetic term, having the ion mass as discussed in the earlier section. Our model reduces the computational cost. Our model accounts for most of the discussions given in the literature [24] to understand the I-V characteristics in solid-state nanopores. In the future, we have to understand the surface potential for the silicon nitride nanoporous membrane to improve our model. Figure 5 shows the current-voltage simulation for the nanopore. We observe linear I-V characteristics for 1 M KCl inside the nanopore. The conductance for 1 M KCl inside the nanopore is 0.62 nS, which matches the literature [24].
Table 34: Conductance and nanopore [24] list 1 model parameters. The concentration of KCl is 1000 mM.
Table 35: Conductance and nanopore [24] list 2 model parameters. The concentration of KCl is 1000 mM.
Table 36: Conductance and nanopore [24] list 3 model parameters. The concentration of KCl is 1000 mM.
Figure 5: 5: I–V Characteristics for nanopore.
4. Conclusion
In this paper, we study using low computational cost numerical simulation for ion transport inside the nanopores and conical nanopores. We study the current-time, 1/f low-frequency noise, conductance variation with the concentration, current-voltage in nanopores, and studies in conical nanopores. We found that current noise is present inside the nanopores and conical nanopores. The study should help to understand solid–state nanoporous membranes for energy, water desalination, DNA sequencing, and neuromorphic computing applications.
 Help ?


